It was a wild day in the financial markets.
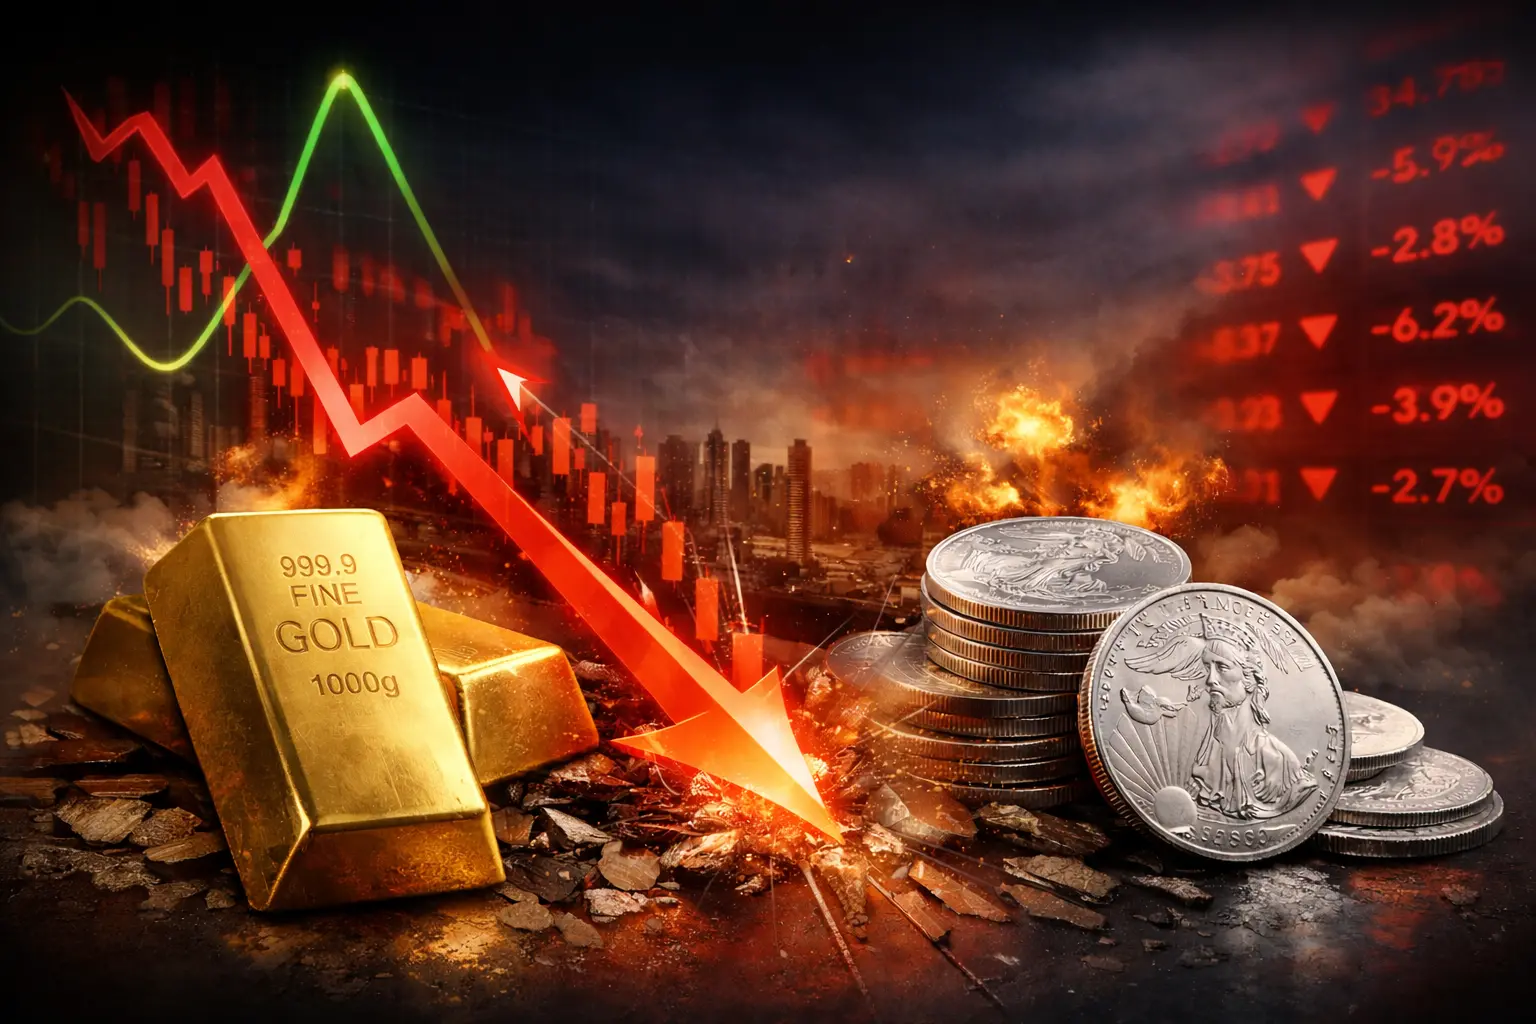
Gold prices plummeted, and silver followed, wiping out trillions of dollars in market value. In the process, gold fell roughly 12% on the day, from near $5,600 to just under $5,000. The decline was much larger for silver, which fell by as much as 36%, from above $121 to near $75.
What stood out was not only the size of the move, but the speed with which it unfolded after weeks of steady gains and one-way positioning.
That sell-off translates to losses of roughly $3–$5 trillion in gold’s market value and $1–$2 trillion in silver’s, before accounting for the knock-on effects that spilled into other risk assets.
To understand just how unusual this decline was, it helps to break it down.
Was This an Extreme Move?
By any historical measure, the sell-off was unusually severe. Silver’s decline far exceeded what is typical in day-to-day trading, while gold, usually far more stable, saw its largest single-day drop since the early 1980s.
Estimates vary depending on how volatility is measured, but the move was well beyond what markets would consider routine. Even under more conservative assumptions, both metals saw price swings usually reserved for rare, stress-driven environments.
For context, daily moves in gold and silver typically fall within roughly 1–1.5%. Moves several times larger than that are considered extreme. On Jan. 30, both markets pushed far past those bounds and set new modern-era records.
Whether framed in statistical terms or simple historical comparison, the takeaway is the same: this was not a typical correction. It was a sharp reset that reflected how stretched positioning had become.
The chart below (via SeekingAlpha) highlights just how far prices moved relative to recent history.
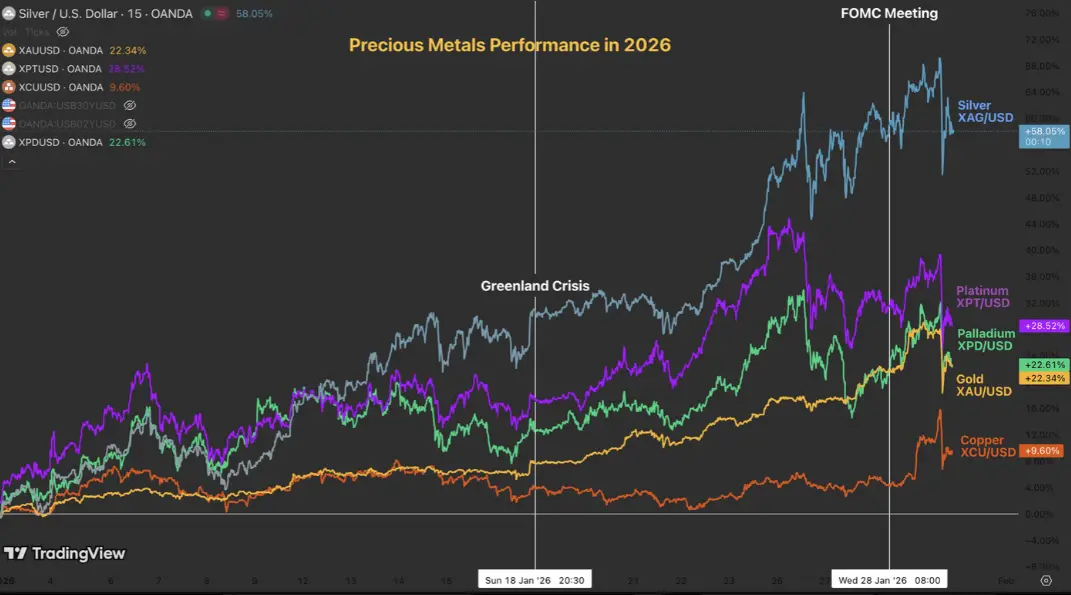 Multi-asset chart showing the rally and key events leading into the reversal
What Triggered the Sell-Off
This was neither a supply surplus nor a sudden drop in demand. It followed an enormous rally in gold (up 29%) and silver (up 68%), driven by geopolitics, de-dollarization fears, and safe-haven buying.
The shift in expectations came fast. When President Trump named Kevin Warsh as his pick for the next Federal Reserve Chair, markets read it as a more hawkish signal. The U.S. dollar rose roughly 0.5–1%.
A stronger dollar is a headwind for dollar-priced commodities because it makes metals more expensive for foreign buyers. With month-end approaching, profit-taking picked up, especially as portfolios rebalanced.
Leverage then took over. Positions unwound quickly, leading to margin calls and forced selling as liquidity thinned and stop-loss orders kicked in.
Retail holders of silver ETFs, including iShares Silver Trust (SLV), took the brunt of it. Sentiment had already been stretched, with RSI readings above 80 pointing to an overdue pullback. As concerns about a U.S. government shutdown faded, some of the fear premium faded as well, removing a layer of price support.
Immediate Market Impact
Right now, this move feels more like a positioning reset than the end of the bull market, as fundamentals still look solid. Central banks continue to hoard gold, industrial demand for silver remains strong, driven by solar and electric vehicles, and global debt (now estimated at roughly $111 trillion) has increased demand for hard assets as a hedge.
However, the move also exposed cracks in market structure.
Stocks dipped on Friday, with the S&P 500 closing down 0.43% and the Nasdaq down 0.94%. Bitcoin fell as much as 7% before eventually rebounding. It served as a wake-up call for just how interconnected these markets have become.
| Asset | Jan 30 Close | % Change (Close-to-Close) | Intraday Low % Drop | Est. Sigma Level | Value Wiped (Trillions USD) |
|---|---|---|---|---|---|
| Gold | $4,907.50 | -8.35% | ~14% from high | 8–12 | $3–5 |
| Silver | $85.25 | -25.5% | ~36% from high | 14 (10-yr vol) | $1–2 |
This table breaks down the damage across both metals. Silver’s move was comparable in intensity to Black Monday–era volatility.
How This Compares to Past Crashes
A lot of people are looking for context on how this event stacks up historically. There isn’t a perfect match, but a few episodes help frame the scale and the mechanics:
Single-day shocks (speed + leverage)
- Black Monday (1987): The Dow dropped 22.6% (often modeled as a 20–22 sigma move) amid program trading and stretched valuations. The market recovered over the next few months, but it also helped drive the adoption of circuit breakers.
- Silver Thursday (1980): The closest metals analog. Silver collapsed roughly 50% in a single day, often estimated at 10+ standard deviations, after the Hunt Brothers’ position unwound and a highly leveraged corner failed.
Systemic crisis (credit + forced selling)
- Global Financial Crisis (2008): Several 5–10 sigma days followed Lehman Brothers’ collapse. Roughly $30 trillion in equity value was erased, and large-scale bailouts and quantitative easing were needed to stabilize the system.
Exogenous shock (fear + policy response)
- COVID crash (2020): The S&P 500 fell about 34%, with repeated 5–7 sigma spikes as lockdown fears hit. The Federal Reserve moved quickly, which helped set up the V-shaped recovery.
Bubble unwind (slow-motion drawdown)
- Dot-com bust (2000): The Nasdaq fell roughly 78% over multiple years as tech hype broke. It wasn’t a one-day collapse, but the value destruction, around $5 trillion, was still massive.
Across all of these, the common thread is leverage and the speed at which sentiment flips when positioning gets crowded. This episode is sector-specific (metals), and it’s unfolding during a period of meaningful policy shifts.
This comparison (via Fortune) shows how the sell-off extended beyond precious metals.
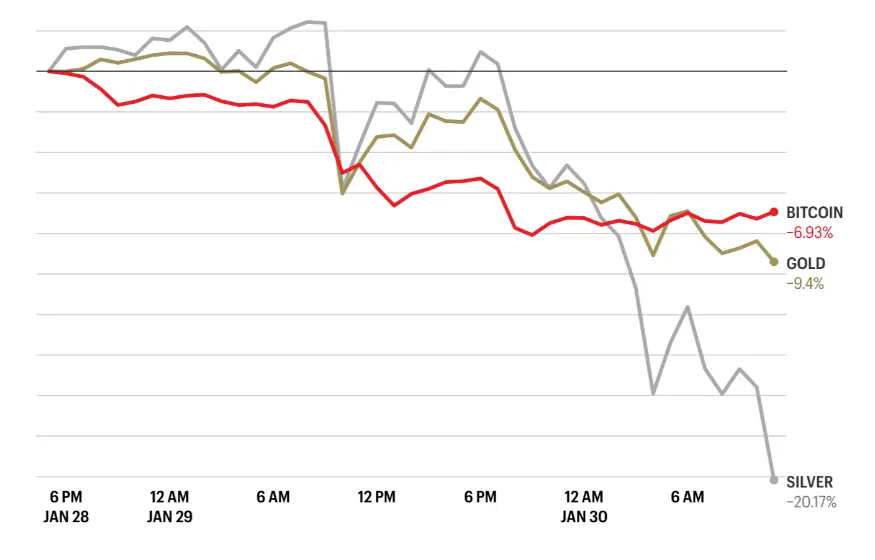 Line chart highlighting silver’s outsized drop relative to gold and bitcoin
Any recovery from the 2026 crash will depend on where prices find technical support, as well as underlying fundamental economic conditions.
Macro Stress and Structural Shifts
There are significant economic uncertainties on the horizon. Trump’s policies have the potential to raise inflation and increase borrowing costs. Given the current backdrop, a “soft landing” looks unlikely: easing monetary policy would weaken the dollar, while tighter credit risks breaking things elsewhere in the system.
U.S. national debt stands at an all-time high of $36 trillion, and many expect bondholders to begin losing confidence in the government’s ability to meet its obligations. If that happens, banks may pull back on lending, echoing the kind of credit tightening seen during the 2008 financial crisis. This coordinated decline across markets is a warning sign that could further erode global economic stability.
However, this market downturn may also signal a transition toward a multipolar world order. In that environment, precious metals may become increasingly attractive to investors looking for protection against the potential weakening of fiat currencies.
Market Outlook for 2026
The evidence points to a bearish tilt in market sentiment.
Liquidity risk remains high and could drive further deleveraging. A stronger dollar and rising interest rates will likely continue to weigh on non-yielding assets like precious metals. If the trend continues, gold could retest its recent low near $4,180.
A deeper correction of 5–20% to roughly $3,360–$3,990 is also possible if the U.S. enters a reflationary period. Should silver break below a key support level, a substantial bear phase could be on the table.
Given the parabolic nature of the prior move, downside risk remains elevated. Gold’s price trajectory over the past three years (via Yahoo Finance) highlights how sharp and accelerated the rally was ahead of the reversal.
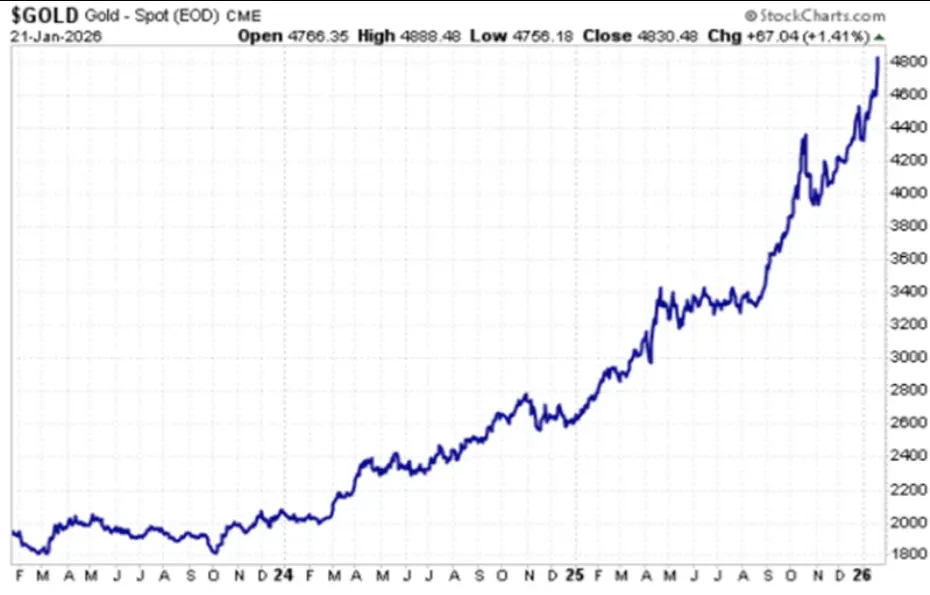 Long-term chart showing the parabolic rise in gold prices prior to the sell-off
Volatility aside, the good news is that gold will often trade sideways for several weeks (or even months), and then may suddenly experience a large price increase of 8–20%. The floor remains intact due to continuous purchasing by central banks.
What This Means Going Forward
The recent volatility is a reminder that risk management matters just as much as conviction in today’s markets. Diversification and unleveraged exposure remain essential.
In this environment, outcomes are often shaped less by forecasts and more by positioning and discipline.
Events like this serve as a reminder that market structure and positioning can matter as much as fundamentals. The durability of the gold and silver rally will become clearer as positioning normalizes and price discovery resumes.